Sulphur Springs ISD received an overall B on the 2021-2022 report card issued by Texas Education Agency, based on three domains: student achievement, school progress and how well the district is “closing the gaps.”
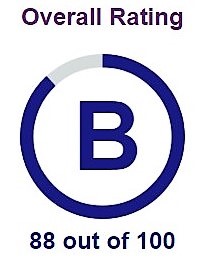
“We received an 88. I’m pretty excited about that and an 89 in progress too,” SSISD Superintendent Michael Lamb said. “We are right at 90% in academic growth, which we’re real proud of. Relative compared to other similar districts we are at 90%.”
The district earned and 89 in school progress, missing an A by less than 1%, according to Lamb, and also received a “closing the gaps” score of 87. The superintendent said it appears that the district is back to the level it was at before COVID swept the world in 2020, which means they are back on track to meet goals established for the district previously and since then.
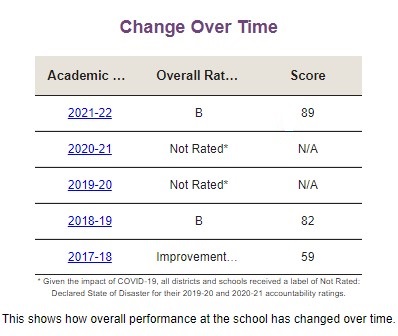
The 2021-2022 school year is the second consecutive SSISD has earned 88 out of a possible 100 points, to receive an overall B on the annual reported card. SSISD received a B for 2017-2018 with an 84 overall score and in 2018-2019 with an 88 overall score during the 2018-20219 school year. The last year districts were officially rated due to COVID-19 impacts was 2018-2019.
As is often the case when state or federal government are involved in setting standards and ratings, school report card ratings and separate pieces within are determined based on what some might consider complicated formulas.
Student Achievement
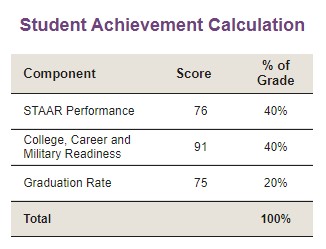
Student Achievement ratings are based on three things — STAAR performance (40% of the overall rating); college, career and military readiness (40%) and graduation rates (20%).
STAAR performance measures achievement at approaches, meets and masters grade level or above on STAAR tests. This is figured by determining the percentage of students in each of the three ratings categories, totaling the percentage points and dividing by three to get the average.
Roughly 76% of SSISD students were determined to be approaching grade level or above in all subjects on STAAR tests, 50% met or exceeded grade level and 25% mastered or exceeded grade level expectations in all STAAR tests.
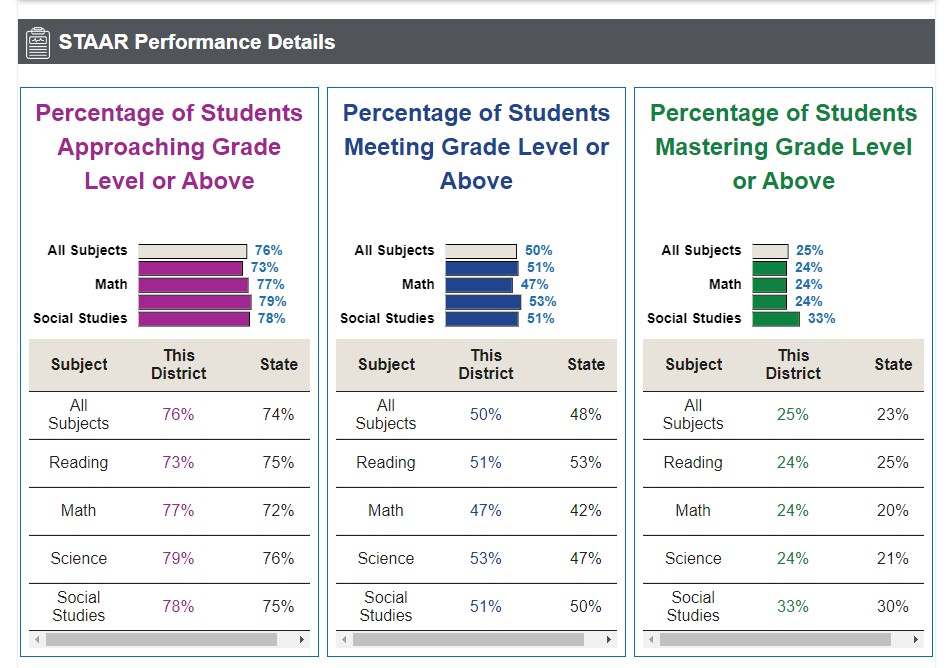
A total of 64% of SSISD students received total credit for college, career and military readiness (CCMR) criteria, 1% higher than the state average. Only 21% of SSISD students taking tests such as the SAT, ACT or TSIA or who earned credit for a college prep course were determined to be college ready; that’s 20% lower than the state average. Only 7% met criterion scores on AP/IB exams; the state average is 21%. Thirty percent of SSISD students did, however, earn an industry-based certification, 11% higher than the state average. Forty percent of SSISD student earned college credit for at least one dual credit course, 14% over the state average. Four percent of SSISD students graduated with completed individualized education program and workforce readiness, twice the state average. Ten percent of SSISD students graduated in 2021-2022 under an advanced diploma plan and identified as a current special education student, more than twice the state average of 4%.
A total of 92% of students graduated in four years, 93% in five years, 93.4% in six years. The state average was a 90% graduation rate for students attending high school for four years, 92.2% five years, 92.6 percent six years. SSISD’s dropout rate was 3.6%, which is 1.2% higher than the state average.
District Progress
School progress rating consists of academic growth and relative performance scores. SSISD earned 90 for academic growth by students from one year to the next, 90 for relative performance (how SSISD performance stacks up against other schools with similar economically disadvantaged populations; 59.7% of SSISD students are considered economically disadvantaged.). Overall, SSSID only earned an 89 for school progress, however, according to the TEA formula.
Closing the Gaps
Closing the gaps scores include academic achievement, graduation rate, English language proficiency and school quality scores. SSISD earned 100% on English language proficiency and school quality, met 70% of academic achievement targets but only met 57% of targets for graduation rates.
SSISD Rated Campuses
SSISD served 4,329 students at 9 campuses in 2021-2021, up from an enrollment of 4,304 in 2020-2021, although only five district campuses received ratings last year:
- Douglass ECLC (paired with SSISD) — B (see district data above for Douglas ECLC as the campus rating, as the Head Start 3-4 and prekindergarten campus is paired with district data)
- Sulphur Springs Elementary — B
- Sulphur Springs High — B
- Sulphur Springs Middle — B
- Travis Primary — C
Sulphur Springs Elementary
Sulphur Springs Elementary, a campus serving 617 students during the 2020-2021 school year, earned a total of 89 out of a possible 100 points, garnering an overall B rating. That’s 7 points higher than during the 2018-2019 school year, when SSES earned a B rating, and 30 points higher than during the 2017-2018 school year, when the campus was rated “improvement required.”
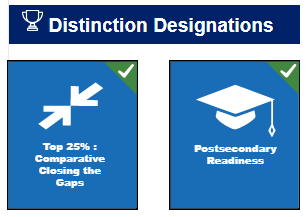
Overall, SSES students earned 79 points for student achievement, 90 for school progress and 86 for closing gaps. SSES also earned Distinction Designations for postsecondary readiness and top 25% for comparative in closing the gaps.
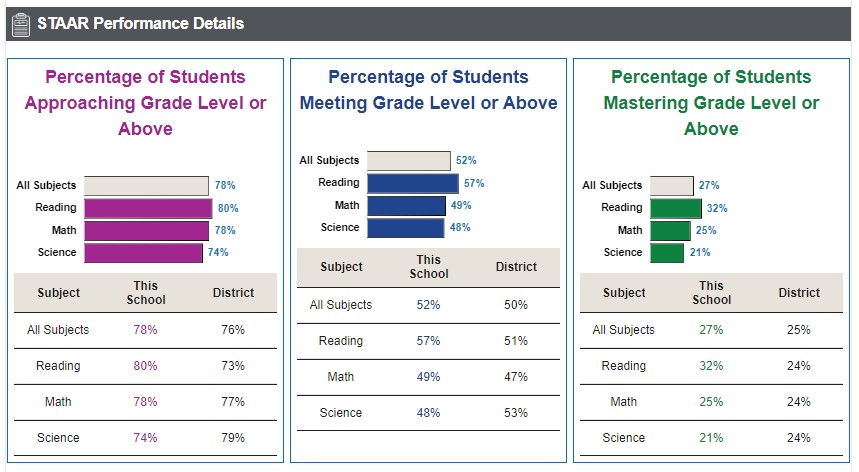
SSES’ student achievement is based solely on the students STAAR performance on reading, math and science tests the campus received 79 out of a possible 100 points. Seventy-eight percent of the fourth and fifth grade students at SSES last year “approached” or above, 52% met or exceeded grade level and 27% mastered or exceeded grade level on STAAR testing. In fact, the SSES students’ scores were ahead of state averages on every test except science.
The Bell Street campus received an A in school progress — 90 points for academic growth students have made from year to year, and 84 points for relative performance on STAAR compared to other districts with similar economically disadvantaged populations; 64% of SSES students were considered economically disadvantaged during the 2021-2022 school year.
SSES met all of the targets set to close gaps during the 2021-2022 school year — 70% of academic achievement targets were met, 100% of growth targets, 100% of English language proficiency targets (measures emergent bilingual/English learners’ progress toward achieving English language proficiency), and 100% of student success targets across all student groups on STAAR tests.
Sulphur Springs Middle School
Middle School served 1,009 students in grades 6-8 during the 2020-2021 school year and earned 86 out of a possible 100 points, for a solid B report card. That’s just higher than the past 2 ratings of 83 in 2017-2018 school year, when SSMS “met standard,” and 85 in 2018-2019, which rated a B overall.
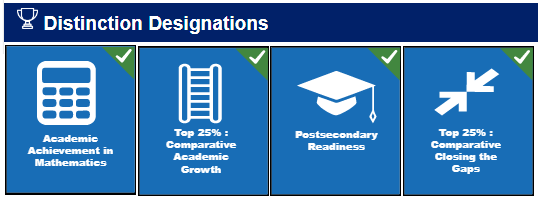
SSMS earned Bs on all thee performance measures: an 84 for student achievement, 86 for school progress and an 85 in closing gaps. The Middle School also received four Distinction Designations: Academic Achievement in mathematics, Top 25% comparative academic growth, postsecondary readiness and top 25% comparative closing the gaps.
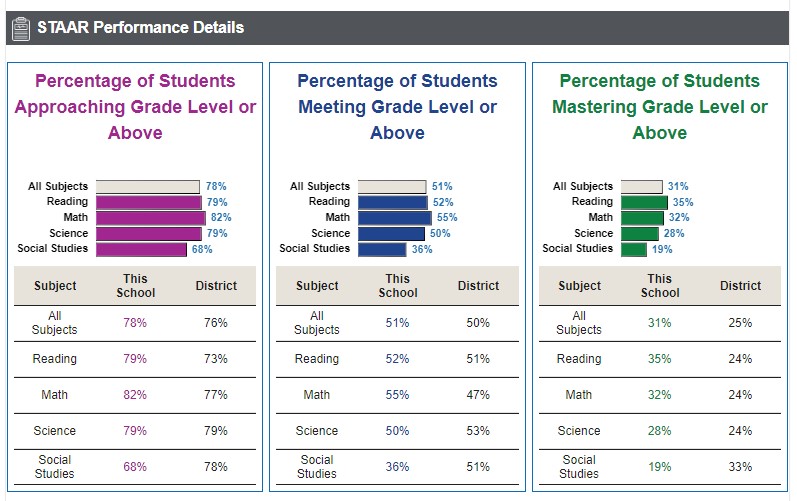
The 84 score for student achievement component consists completely of 6th-8th graders’ 2021-2022 STAAR scores. Middle school students were tested in reading, math, science and social studies. Overall, 78% of SSMS students approached or were above grade level, 51% met grade level or above and 31% mastered or exceeded grade level on all STAAR subjects during 2021-2022 testing.
The campus matched or exceeded nearly all state averages as far as approaching, meeting and mastering all STAAR subjects, with the exception of social studies. At the state level, 78% of middle school students tested either “approached” or scored above grade level, 51% met or exceeded grade level, and 33% mastered or exceeded grade level standards on STAAR social studies tests. At SSMS, 68% approached or exceeded, 36% met or exceeded, and 19% mastered or exceeded grade level on social studies STAAR tests.
The school progress score consisted of 86 points out of 100 for academic growth and 85 points for relative performance on STAAR compared to other districts with similar economically disadvantaged populations; that is 52.2% of SSMS students were considered economically disadvantaged. They scored 53; the campus needed 58 to earn an A, 48 to earn a B, and 43 to earn a C.
Sulphur Springs High School
High School served 1,247 students in grades 9-12 during the 2020-21 school year and earned an overall 80 out of a possible 100 points, garnering an overall B report card rating for the 2021-2022 school year. That’s the same rating as in the 2018-2019 school year, when the campus earned 82 points. During the 2017-2018 school year, SSHS “met standard” with 84 points overall.
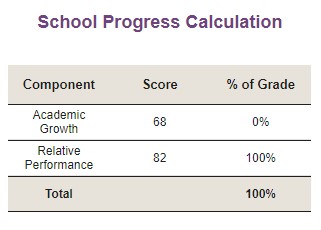
The high school earned 82s in student achievement and school progress, and 75 on closing the gaps.
For student achievement, SSHS students earned 76 points for STAAR performance; 91 for college, career and military readiness; and 75 for graduation rates.
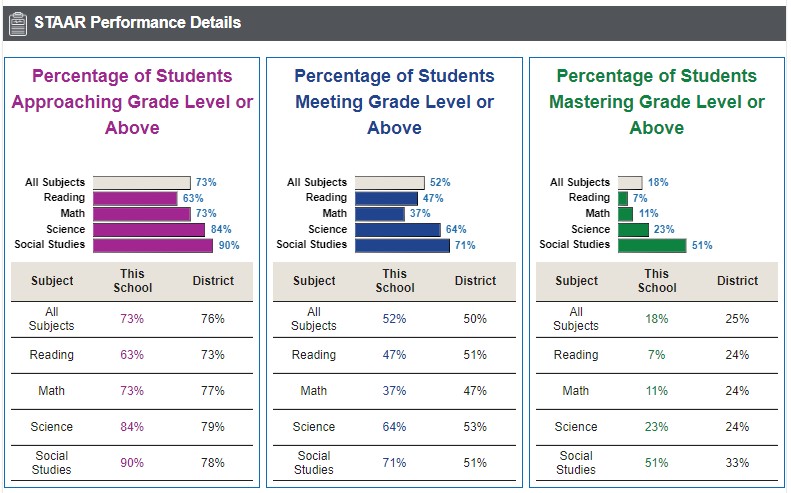
SSHS students took reading, math, science and social studies STAAR tests. Overall, 73% rated “approaches” grave level or above, 52% met grade level or above and 18% mastered or exceeded grade level in all subjects.
The SSHS CCMR ratings and percentages are the same as those for the district as they are used to figure district totals. A total of 64% of SSHS students received total credit for college, career and military readiness (CCMR) criteria, 1% higher than the state average. Only 21% of SSISD students taking tests such as the SAT, ACT or TSIA or who earned credit for a college prep course were determined to be college ready; that’s 20% lower than the state average. Only 7% met criterion scores on AP/IB exams; the state average is 21%. Thirty percent of SSHS students did, however, earn an industry-based certification, 11% higher than the state average. Forty percent of SSHS students earned college credit for at least one dual credit course, 14% over the state average. Four percent of SSHS students graduated with completed individualized education program and workforce readiness, twice the state average. Ten percent of SSHS students graduated in 2021-2022 under an advanced diploma plan and identified as a current special education student, more than twice the state average of 4%.
A total of 92.6% of Sulphur Springs students graduated high school in four years, 93.3% in five years, 93.4% in six years. SSISD’s dropout rate was 3.6%, which is 1.2% higher than the state average.
In the school progress category, SSHS received 68 points earning a “not rated” label for academic growth, but received 82 points for school performance relative to others school’s with similar economically disadvantaged populations, and a 56 STAAR and CCMR average score relative to schools with an economically disadvantaged population (which is considered a B). SSHS’ had a 47.5% economically disadvantaged population during the 2021-2022 school year.
In “closing gaps,” SSHS received scored 12.5 points (25%) out of the possible 50% in academic achievement targets; 5.7 points (57%) out of the possible 10% of graduation rate targets; received no score for progress in English language proficiency by emergent bilingual/English learners; and 100% (30 points) of targets for school quality which measures readiness for college, workforce or military across student groups.
Travis Primary
Travis Primary, a campus which served 292 students from kindergarten through third grade during the 2020-21 school year, earned 71 points, garnering a C report card rating last year. That’s an improvement over 59 points Travis received in the 2017-2018 school year, when the campus earned an “improvement required” ranking, and the 66 points received in the 2018-2019 school year, when the school earned a D rating.
The campus received 72 points for school progress, but only 69 for student achievement on STAAR tests and 67 for closing the gaps, and thus, were not rated on the last two domains. Travis did, however, earn a Distinction Designation for Academic Achievement in English/language arts and reading.
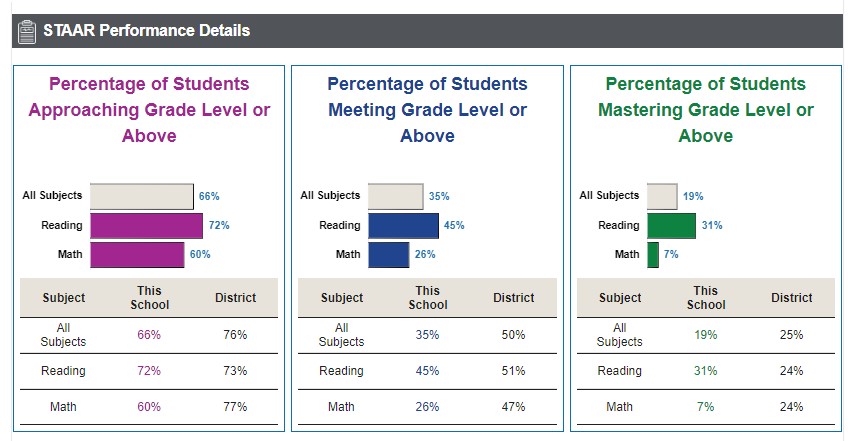
Travis third graders were STAAR tested in reading and math. Overall, 66% “approached” grade level or above, 33% met or exceeded grade level and 19% mastered or exceeded grade level on all STAAR tests.
In the school progress domain, Travis Primary didn’t receive points for academic growth but did receive 72 points for relative performance compared to other schools with economically disadvantaged populations similar to the campus’ 75.7%. The campus needed 39 relative STAAR performance points and earned 40.
In the closing gaps domain, Travis met 30% of targets on academic achievement on STAAR grade level performance at or above standard in reading in math in all student groups, met 100% of targets for English language proficiency among emergent bilingual/English learners, and 17% of student success targets for student performance on STAAR across all student groups.
SSISD Campuses “Not Rated”
To align with Senate Bill 1365, a school receives a “Not Rated” label when the domain or overall scaled score is less than 70.
A school district or campus does not receive a rating for one or more of the
following reasons:
- The district or campus has no data in the accountability subset.
- The district or campus has insufficient data to assign a rating.
- The district operates only residential facilities.
- The campus is a juvenile justice alternative education program (JJAEP).
- The campus is a disciplinary alternative education program (DAEP).
- The campus is a residential facility.
- The commissioner otherwise determines that the district or campus will not be rated.
The four SSISD campuses designated as “not rated” include:
- Barbara Bush Primary — 69 out of 100
- Bowie Primary — 66 out of 100
- Rowena Johnson Primary — 63 out of 100
- Austin Academic Center — 65 out of 100
Barbara Bush Primary
Barbara Bush Primary, a campus serving 332 students from kindergarten up to third grade during the 2020-2021 school year, earned 69 points overall during the 2021-2022 school year and, thus, was not rated. That’s better Bush’s 2017-2018 score of 59, which garnered an improvement needed rating, but still nearly 20 points shy of the campus’ 2018-2019 score of 88, which garnered a B rating.
Bush Primary earned a 70 on student achievement (overall STAAR performance on math tests), a 72 on school progress, and a 61 on closing the gaps, putting the campus just 1 point out of a C rating.
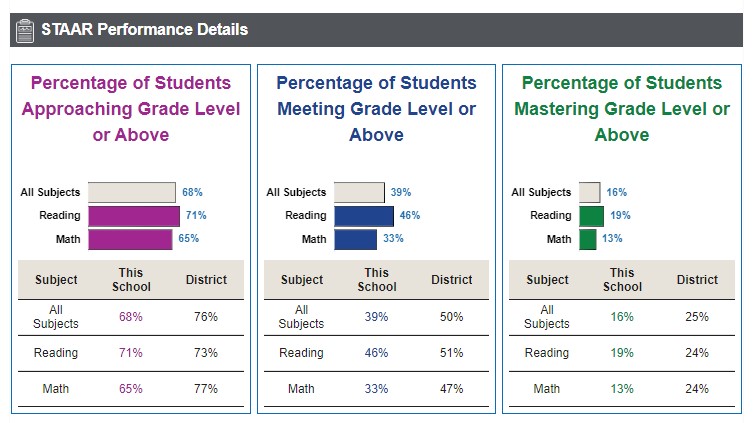
On STAAR tests, 68% of Bush Primary students were rated as “approaching” grade level or above, 39% met or exceeded grade level and 16% mastered or exceeded grade level, in reading and math tests.
Bush, which consisted of 73.5% economically disadvantaged students, scored 72 out of 100 points for relative performance compared to other schools with similar economically disadvantaged populations.
Bowie Primary
Bowie Primary, a campus serving 304 students from kindergarten through third grade during the 2020-2021 school year, earned 66 out of a possible 100 points during the 2021-2022 school year and, thus, was not rated. While better than the “Improvement Required” rating of 2017-2018 when Bowie’s overall score was, 59, the 2021-2022 score was still shy of the C rating the campus received during the 2018-2019 school year with an overall 70 score.
Bowie earned a 72 student achievement score based on the campus’ overall STAAR performance rating, 66 for school progress and 52 for closing the gaps.
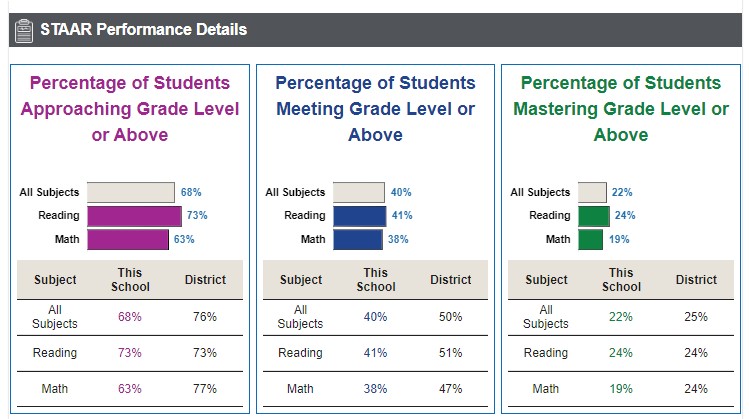
On STAAR tests, 68% of Bowie students’ scores in all subjects (reading and math) were “approaching” grave level or above, 40% met or exceeded grade level, and 22% mastered or exceeded grade level.
Overall, Bush Primary only received an overall 66 out of a possible 100 points based on students’ STAAR performance relative to other similarly economically disadvantaged populations. Bowie’s student population consisted of 54.6% economically disadvantaged students.
Rowena Johnson Primary
Rowena Johnson Primary, a campus serving 295 students from kindergarten through third grade, earned an overall 63 out of 100 points during the 2021-2022 school year, and wasn’t rated. However, the 2021-2022 score is still better than the two previous ratings. Johnson received a score of 59 in 2017-2018, garnering an improvement needed ratings, and a 58 in 2018-2019, giving the campus an F rating that year. D
The campus received a 69 in student achievement (STAAR rating), a 70 in school progress and a 48 in closing the gaps, giving the campus an overall 63 score this year.
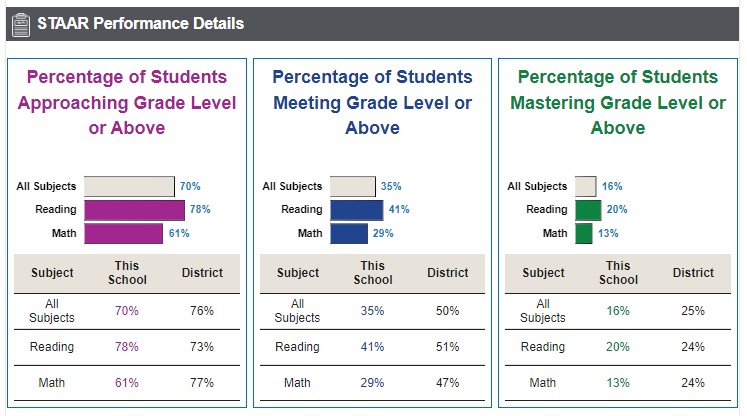
During the 2021-2022 school year, 70% of all Johnson Primary students tested were “approaching” grade level or above, 35% were meeting or above grade level and 16% mastered or exceeded grade level on STAAR tests in reading and math STAAR tests.
Johnson Primary earned a 70 or C rating for relative performance compared to other schools with similar economically disadvantaged populations; 72.4% of students at Rowena Johnson Primary were economically disadvantaged during the 2021-2022 school year.
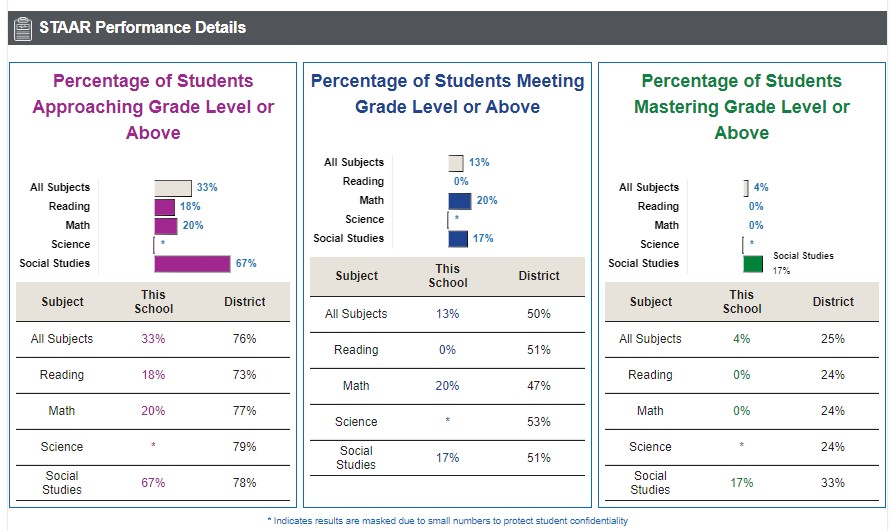
Austin Academic Center
Austin Academic Center scored 65 out of a possible 100 points, and thus was “not rate.” According to TEA, alternative standards were used to rate AAC. In fact, 2021-2022 school year is the first time AAC has been rated, thus, there was no prior data to assess school progress and closing the gaps, so the total score comes from students’ STAAR performance.
Overall, 33% of AAC students were “approaching” or above grade level, 13% met or exceeded grave level and 4% mastered or exceeded grade level criteria on reading, math, science and social studies tests during the 2021-2022 school year.