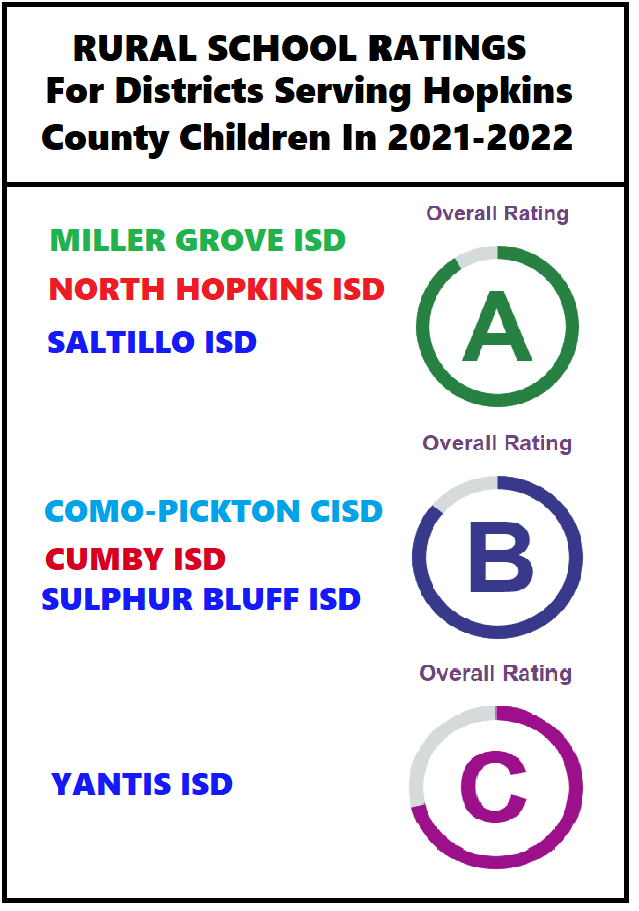
Yantis ISD Receives C Accountability Rating
Miller Grove, North Hopkins and Saltillo all earned As on school report cards, while all of the other rural Hopkins County schools received Bs from the state. Yantis ISD, located in nearby Wood County but which serves some Hopkins County students, received a C 2021-2022 accountability rating from Texas Education Agency.
Some were ranked strictly as a district, while others had campus raked on school report cards.
The biggest concerns expressed over the past couple of years after the first rounds of benchmark and state testing were the impact of 2 1/2 months worth of instruction time lost in 2020 due to mandatory COVID-19 shutdowns, as well as the loss of in-person instruction time over the next 2 school years as students and staff were forced to quarantine or self-monitor at home due to COVID exposures or positive test result. In some cases, parents opted to have their students participate in remote learning as a precaution against the virus. Extra measures were implemented over the past year at most schools to help students who did not test at their grade and aptitude levels catch up with their peers and state benchmark requirements. If the extra help didn’t attain the desired results, additional or different programs, including extra staff, were employed to help those still struggling get the extra instruction needed for advancement or promotion.
Hopkins County seems to have stepped up to the challenge, with all school districts located within Hopkins County finishing with As and Bs overall. School report card scores reflect ratings in three domains — student achievement, school progress and closing the gaps ratings.
Student Achievement measures whether students met expectations on the STAAR test. It also measures graduation rates and how prepared students are for success after high school. School Progress shows how students perform over time and how the school’s performance compares to other schools with similar economically disadvantaged student populations. Closing the Gaps tells us how well a school is ensuring that all student groups are successful, according to TEA.
Schools also had the ability to earn distinction designations in up to seven areas. Distinction Designations are awarded when a school or district shows exceptional achievement in these areas.
Miller Grove ISD
Miller Grove ISD, a campus serving 299 students from prekindergarten through 12th grade, earned an A with an overall score of 91, the the highest overall score among school districts within Hopkins County. The district received a 90 on student achievement, 91 on school progress and 90 in closing the gaps.

MGISD also received five Distinction Designations for academic achievement in English/language arts and reading and mathematics, post secondary readiness, top 25% of comparative in closing gaps, and top 25% comparative for academic growth.
“We were really pleased to get an A. Technically, I think you’ll see once you look at all the stats together, we are the highest in the county — by 1 point. point,” MGISD Superintendent Steve Johnson said. “A lot of our kids get associate’s degrees. That helped us.”
Johnson said while many offered or started their 2020-2021 school year with remote learning, MGISD was able to get away from it pretty quickly. It didn’t take educators long to see that remote learning wasn’t working well for most students, and started the 2021-2022 school years in-person only. Fortunately, MGISD did not have to close due to COVID after that point, but did have some students who had to quarantine at home, Johnson said. Having a fulltime nurse to track COVID cases was very helpful, the superintendent noted.
Even so, multiple students took advantage of the dual credit English and math courses taught or proctored at MGISD by staff, and offered at no charge to the students, thanks largely to the break on tuition by Paris Junior College. The district then offered a period in which students enrolled could take online college courses could all go to the lab for course online course work in their class, with a teacher or school staff member in the room to monitor students taking the various different classes. Students were able to take additional college courses to work toward a two-year certification or degree. As a result, a “good amount of kids” attained an associate’s degree as well as a high school diploma in spring 2021,” according to Johnson.
MGISD had a 100% graduation rate; with 96% of students meeting college, career and military readiness standards; 11% scored at or above standard on college readiness tests and course (SAT, ACT, TSIA, college degree prep course), 68% earned college or dual credit, 26% received industry-based certification and 32% earned an associate’s degree, with 5% graduating under an advanced diploma plan and were identified as a current special education student, according to the TEA data.
A total of 84% of MGISD students achieves “approaching” grade level or above standard, 55% met grade level or above and 20% mastered grade level or above, according to the TEA report card.
During the 2020-2021 school year, the district had an enrollment of 306 students, approximately 52% of which were economically disadvantaged, 9.5% received special education services, 3.9% were emergent bilingual or English learners. The district composition was 80.4% White, 16.7% Hispanic, 1.3% two or more races, 0.3% American Indian, 0.3% Asian, 0.7% African American and another 0.7% Pacific Islander
MGISD had 40 full-time staff, 30.1of which were full-time teachers whose average salaries were $48,523 during the 2020-2021 school year, according to the TEA report card data.
North Hopkins ISD
Although both North Hopkins Elementary and High School each earned an overall B, North Hopkins ISD as a whole earned an overall A rating, scoring 90 out of 100 points. The district as a whole received a 91 for student achievement, a 93 for school progress and 83 out of 100 points for closing the gaps.
“We are very excited about our A rating! This is no doubt a reflection of the hard work that was put in by everyone last year and the strategies our folks have put in place to help our students achieve at a high level. Our students have shown much drive and determination to close the gaps brought on by the early days of the pandemic. I am so very proud of our school and our community and commend them for achieving this mark!” NHISD Superintendent Brian Lowe said.
NHISD also earned a Distinction Designation for Postsecondary Readiness, after scoring a total 96 out of 100 points for college, career and military readiness achievement.
North Hopkins ISD had a 100% graduation rate and received 82 out of 100 points for STAAR performance. A total of 84% of NHISD students earned total credit for college, career and military readiness criteria — 9% scored at or above the college readiness standard on SAT, ACT, TSIA tests or earned credit for a college prep course; 7% met criterion score on AP/IB exams; 58% earned college or dual course credit, 53% received industry-based certification; 4% earned an associate’s degree; and 13% graduating under an advanced diploma plan and were identified as a current special education student, according to the TEA data released earlier this month.
As a whole, 79% of district students were considered to be approaching grade level or above on composite STAAR performance, 51% met grade level standard or above, and 23% of students mastered all subjects on the STAAR tests.
NHISD earned 87 out of a possible score of 100 for school progress and 93 for relative performance, giving the district an overall 93 for school progress (how students perform over time and how the district performs compared to other districts with similarly economically disadvantaged student populations).
The closing the gaps score is based on how well the district is ensuring that all student groups are successful. NHISD earned a total 83 out of 100 points in this area.
North Hopkins Elementary during the 2021-2022 school year, received 82 out of a possible 100 points, giving the campus serving 315 prekindergarten through sixth grade students a B overall score.
North Hopkins High School, which served 240 students in grades 7-12 during the 2021-2022 school year, finished a little higher than NHES, earning 87 out of 100 possible points, giving the campus a solid B rating. NHHS scored 89 in the student achievement category, 91 in school progress and 78 in closing gaps. As a whole, the campus earned academic achievement in science and postsecondary readiness.
District enrollment at NHISD was 535 last year, down from 555 one year before. The 20202-21 student population was 62.7% of those students considered economically disadvantaged, 12.4% receive special education services and 11.5% are emergent bilingual/English learners. The district student composition is 71.7% White, 23.4% Hispanic, 3.8% two or more races, 1.1% Asian, 0.2% American Indian and 0.7% African American.
NHISD had 91.5 full-time staff, 46.8 of whom are full-time teachers. The average salary, at NHISD is $49,079, during the 2020-2021 school year, according to the TEA data.
Saltillo ISD
Saltillo ISD, a campus that housed 244 students in pre-kindergarten through 12th grade, earned an overall 90. That gives the district an overall A rating, the same as in 2018-2019, the last school year TEA rated campuses due to COVID closures and absences.
The district earned five Distinction Designations: academic achievement in science and social studies, top 25% comparative academic growth, postsecondary readiness and top 25% comparative closing the gaps.
“The entire Saltillo ISD family does everything in its power to make our district successful. Saltillo ISD is governed by a school board with a clear vision for high quality education. Our students leave high school ready for their next chapter in life; and our community, parents, students and teachers always give maximum effort to achieve greatness,” said Saltillo ISD Superintendent David Stickels.
The school received a 90 in student achievement, 92 in school progress and 86 in closing the gaps.
In student achievement, Saltillo ISD earned 79 out of 100 points for overall STAAR performance; 97 for college, career and military readiness (CCMR), and had a 100% graduation rate.
On the STAAR test, 86% of Saltillo students tested approached grade level above, 52% met or exceeded grade level and 18% mastered all tests at their grade level or above.
A total of 89% of Saltillo students earned credit for CCMR criteria, 11% scored at or above college ready standard on college tests or earned credit for a college prep course; 50 percent earned college credit for dual credit courses; 28% earned an industry-based certification, and 17% graduated under an advanced diploma plan and were identified as a current special education student.
Saltillo ISD’s enrollment was 244 during the 2021-2022 school year, down from 253 one year before. During the 2020-2021 school year, 64.8% economically disadvantaged, 15.8% are special education students, 13% are emergent bilingual/English learners. The District composition is 65.5% White, 28.5% Hispanic, 3.2% African American, 2.8% two or more races, 1.6% Asian; 1% American Indian; and 0.7% Pacific Islander.
The district has 52.9 full-time staff, 26.5 of which are full-time teachers. The average salary at Saltillo ISD is $50,485 during the 2020-2021 school year
Como-Pickton CISD
Como-Pickton CISD received an 84, giving the district an overall B rating for the 2021-2022 school year, the same as during the 2018-2019 school year. Overall, CPCISD earned 87 out of a possible 100 points for student achievement, 86 for school progress and 78 for closing the gaps.

CPCISD was rated as a whole, from early education through 12th grade as they apply to school ratings. Overall, the campus earned Distinction Designation for academic achievement in science.
“In several areas of testing we beat regional averages,” Como-Pickton CISD Superintendent Greg Bower said “We are happy with the scores. I think the teachers have done a pretty great job.
Overall, 75% of Como-Pickton students were rated “approaching grade level or above” on STAAR tests, 44% met grade level or above and 19% mastered or exceeded grade level or above during the 2021-2022 school year, according to the TEA report card data. Overall, the district earned 74 out of a possible 100 points for STAAR testing.
“I am extremely proud of our overall high school. When it comes to approaches and meets [on STAAR testing], our high school has met and exceeded, beaten the state average on every single category and beat regional. I am so proud of them, those principles and teachers worked so hard,” Bower said. “The high school teachers just buckled down really to pulled us up in that.”
The district received 93 points for CCMR, with 70% meeting total credit criteria for CCMR; 15% scored at or above standard on college readiness tests or earned credit for a college prep course, 30% earned college credit for a dual credit course, 45% earned an industry-based certification and 4% graduated under an advanced diploma plan and identified as current special education student at the time. CPCISD earned 100 points for graduation rate.
Bower said moving one teacher from junior high to high school a couple of years ago to teach has really made a difference in the high school science program, for which the district receive distinction.
CPCISD’s student enrollment during the 2021-2022 school year was 724, up from 706 students during the 2021-2022 school year when 67.5% were economically disadvantaged, 14.9% were special education students and 23.1% were emergency bilingual/English learners. Bower noted the district for the 2022-2023 school year has a 6.6% increase in enrollment.
The district student population consisted of 52.4% White students, 40,9% Hispanic, 2.4% two or more races, 1.6% Asian 1.7% African American, 1.6% Asian, 1% American Indian and 0.7% Pacific Islander students.
The district employed 119.9 full-time staff, including 63.2 full-time teachers during the 2020-2021 school year. The average salary for CPCISD teachers was $58,589.
Cumby ISD
Cumby ISD, a district serving 435 students in from pre-kindergarten through 12th grade, received 86 overall points last year. That gave the district a solid B average for the 2021-2022 school year, the same as in the 2017-2018 and 2018-2019 school years.
The district as a whole rated 88 for student achievement, 89 for school progress and 80 for closing gaps.
Overall, in students achievement category, CISD students received 75 out of 100 possible points for STAAR performance, 96 for CCMR and had a graduation rate of 100%. On STAAR tests, 72% of Cumby students approached grade level or above, 42% met grade level standards or above and 17% mastered or exceeded grade level.
Cumby High School not only received 86 points overall for the 2021-2022 school year, but earned three Distinction Designations: academic achievement in mathematics, Top 25% Comparative Academic Growth and Post Secondary Readiness.
Cumby High earned a 88 out of a possible 100 points for student achievement, 89 for school progress and 78 for closing the gaps. Overall on STAAR tests, 75% of CHS students approached or scored above grade level, 47% met or exceeded grade level and 17% mastered or exceeded grade level. CHS students also scored 96 for CCMR and had a 100% graduation rate.
In CCMR, 82% of Cumby High School students met criteria for credit; 67% scored at or above readiness standards on college tests or earned credit for a college prep course; 33% earned college credit for a dual credit course; 30% earned industry-based certification; 15% (5 students) earned an associate’s degree; and 15% graduated under an advanced diploma plan and identified as a current special education student.
Cumby ISD Superintendent Shelly Slaughter said the P-Tech and other things the district has put in place over the last couple of years has made a difference which is reflected in the scores.
Cumby Elementary was Not Rated, which TEA notes schools receive a not rated label when the domain or overall scaled score for the campus is less than 70, in according with Senate Bill 1365. Cumby Elementary scored 64 out of 100 possible points (65 in student achievement on STAAR tests, 62 in school progress and 61 in closing gaps). The elementary campus met standard with an 85 score during the 2017-2018 school year, scored a D with a 65 in the 2018-2019 school year and was acceptable in the 2020-2021 school year although schools were “Not Rated” due to COVID-19.
Slaughter said the district officials are aware there’s room for improvement, and are already making changes to some individual learning plans of students to help meet that challenge. She said district administrators and educators have high expectations for all students and feel that those changes and others implemented over the next year will result in gains for students.
Slaughter said she is excited about the areas of growth that have occurred in the schools, and foresee more as the district continues to transition with P-Tech as an Edu-Nation campus working to provide all students with an opportunity to attain a college or industry certification when they graduate Cumby.
Cumby ISD will offer an information night next week to relay to parents and community members information about what CISD will be doing this year, how that affects academics and programs offered. Those attending are encouraged to bring and ask any questions they may have related to the topics. The meeting will begin at 6 p.m. Sept. 8, 2022.
Cumby ISD served 208 elementary and 212 High School students during the 2020-2021 school year. The district’s student enrollment was 59.5% economically disadvantaged, 14.8% special education students and 4.8% emergency bilingual/English learners during the 2020-2021 school year. The district was composed of 81% White students, 13.3% Hispanic students, 3.6% are two or more races, 1.7% American Indians, 1.1% Asian, 0.2% Pacific Islander and 0.5% African American.
The district employed 70.2 full-time staff, 40.3 of whom were full-time teachers. The average teacher salary at CISD was $48,653 during the 2020-2021 school year.
Sulphur Bluff ISD
Sulphur Bluff ISD earned 83 out of a possible 100 points for an overall report card grade of B from TEA for the 2021-2022 school year. That’s the same rating the district received during the 2018-2019 school year, the last in which all schools were rated due to the state of disaster declared during the 2019-2020 and 2020-2021 school years due to COVID-19.
“Overall, Hopkins County had an impressive showing! It’s great to be a part of this community. At SBISD, we are proud of the work and effort our students and staff have put forth over the last two and a half years of unprecedented disruptions. The hours of work and sacrifice each of our teachers and aides have put forth to help put our kids in a position to succeed is just hard to put into words. Learning is an ongoing process that we strive for everyday, not just for testing and accountability purposes, but for the growth of our kids into successful young adults,” said Dustin Carr, SBISD Superintendent.
Sulphur Bluff students earned an overall 86 for student achievement composed from the district’s overall 76 rating on STAAR tests, 90 on CCMR and 100% for graduation rate.
In STAAR testing, 80% of students approached grade level or above, 47% met grade level or above and 16 percent mastered or exceeded grade level on all subjects tested in.
Overall, 60% of SBISD students earned total credit for CCMR criteria, 33% scored at or above standard on college ready tests or earned credit for a college prep course, 47% earned college credit for a dual credit course, 7% earned industry-based certification and 13% graduated under and advanced diploma plan and identified as a current special education student in the 2021-2022 school year, according to the TEA report card data.
SBISD scored an overall 80 for school progress and 77 out of 100 points for closing the gaps.
The campus served 218 students from early education through 12th graders during the 2020-2021 school year, 50.9% of whom were economically disadvantaged, 14.2% were special education students and 2.3% emergency bilingual/English learners. The student population was 87,2% White, 9.2% Hispanic, 2.8% African American, 1.6% Asian, 1% American Indian, 0.9% two or more races and 0.7% Pacific Islander.
The district employed 42.2 full-time staff, 20.3 of whom were full-time teachers. The average teacher salary at SBISD was $48,175.
Yantis ISD
Yantis ISD, which is located in Wood County but does educate some Hopkins County students, received 71 points for an overall C district rating on the 2021-2022 school report card. That’d down from the B (85) YISD received in 2018-2019 but better than the D the district scored during the 2017-2018 school year, according to the TEA data released earlier this month.
The district earned a 72 for student achievement, a 73 for student progress and a 66 on closing gaps. The student achievement score is compiled based on three components, overall STAAR performance, CCMR and graduation rate.
YISD received an overall 74 out of a possible 100 points for STAAR performance with 73% of students approaching grade level or above on all STAAR subjects tested in, 41% meeting or exceeding grade level expectations on all tests, and 15% mastering or exceeding grade level.
YISD earned a 100 for graduation rates, with 92.3% graduating in four years, 96% in five years and 100% by 6 years, and a drop out rate of 2.3%, according to the TEA data.
YISD’s Elementary and High School were also each individually rated as well.
Yantis Elementary, which served 172 students from prekindergarten through fifth grade, received 81 points, giving the campus an overall B rating. The 2021-2022 rating the same the school earned during the 2018-2019 school year. Elementary students earned a C (72 out 100 points) for student achievement, a B (85 points) for school progress and C (71 points) for closing the gaps. Yantis Elementary students scored 72 points overall for STAAR performance, giving the campus a 72 student achievement score. In STAAR tests, 76% of Yantis Elementary students approached or exceeded grade level, 41% met or exceeded grade level and 16% mastered or exceeded grade level.
Yantis High School, which served 199 sixth-12th graders, received an overall C rating for the 2021-2022 school year, the same as in the 2018-2019 school year. YHS earned 69 points each om school progress, and was “not rated.” To align with Senate Bill 1365, a “not rated” label is used when the domain or overall scaled score is less than 70,
Overall, YHS earned 72 points on student achievement, which factors in the 71 points the campus received for STAAR performance, 58 points for CCMR and 100 for graduation rate. In STAAR testing, 72% of students approached or exceeded grade level, 41% met or exceeded grade level and 14% mastered or exceeded grade level on all STAAR subjects they were tested in.
Only 24% of YHS students earned received total credit for CCMR criteria, 8% scored at or above readiness on college entrance tests or earned credit for a college prep class, 16% earned college credit for a dual credit course and 8% graduated under an advanced diploma plan and were identified as current special education students during the 2021-2022 school year, according to the TEA report card data for YHS.
Also at Yantis High 92.3% graduated in four-years, 96% in five years and 100% in six years. The campus also was reported to have a 2.3% dropout rate.
YISD had a total enrollment of 368 during the 2021-2022 school year, three less than during the 2020-2021 school year when 70.4% of students were economically disadvantaged, 10% were special education students and 11.3% were emergent bilingual/English learners. The campus population was 67.9% White, 29.6% Hispanic, 2.2% two or more races, 1.7% African American, 0.6% Pacific Islander, 0.3% American Indian and 0.2% Asian.
YISD during the 2020-21 school year employed 53 full-time staff, including 31.9 full-time teachers. The average teacher salary at YISD was $48,465.
Click here to select and view school district and campus report card data for the 2021-2022 school years.