Probable Cases, Antigen Test Positivity Rate Added To Reports
Just when you get used to the where and how the state reports COVID-19 information, they switch things up. Another COVID-19 reporting change was announced by Texas Department of State Health Services on Friday. The latest update revamped the COVID-19 data dashboard with a goal of posting additional information and improving functionality.

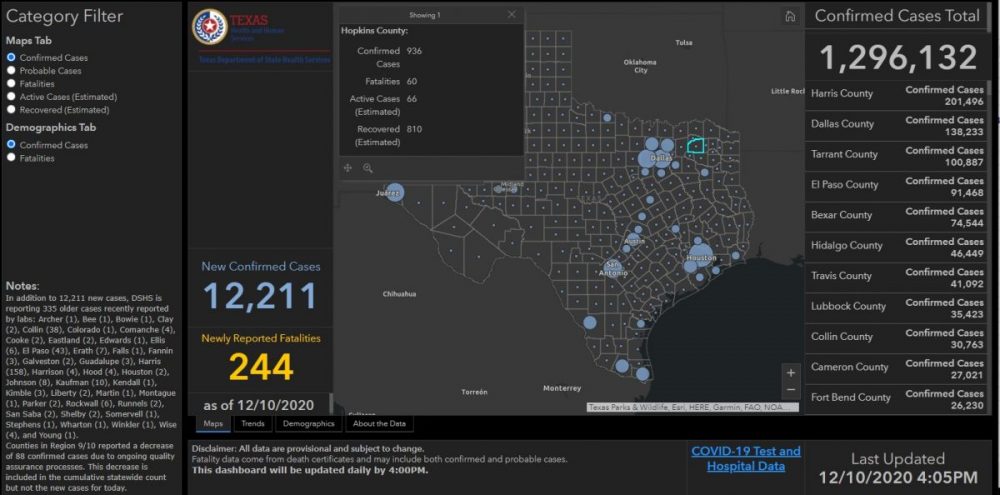
The updated COVID-19 dashboard (which at 3:30 p.m. Dec. 11 still showed the Dec. 10 case counts) consolidated several areas of the dashboard to provide multiple cases for each county in one location, as well as filters for sorting categories by maps and demographic tabs. COVID-19 dashboard users can toggle between confirmed and probable cases, fatalities, and active and recovered estimates by county on a single tab. Case and fatality demographics are also be consolidated onto one tab.
A link on the DSHS COVID-19 page and at the bottom of the case counts dashboard still has be clicked to access testing and hospital data, however.
DSHS added to the testing and hospital dashboard tabs and sorting filters for case counts of probable cases statewide and by county. Probable cases are those identified through antigen testing or a combination of symptoms and a known exposure without a more likely diagnosis. DSHS notes that reporting probable cases provides a more complete picture of how COVID-19 is affecting Texas since both confirmed and probable cases represent active infections. Thus, both will be included in the estimates of active and recovered cases.
In addition to the probable case counts, DSHS is adding a positivity rate for antigen tests. This positivity rate, based on when people were tested, aligns with the most reliable positivity rate for molecular tests, according to DSHS. These positivity rates, which show the percentage of tests taken in a given period that are positive, provide a view of the severity of the pandemic over time, closely reflecting the conditions when people were tested.
“These dashboard refinements are part of our effort to continually improve our insight and response to the ongoing pandemic,” said Dr. John Hellerstedt, DSHS commissioner. “The development and increased use of antigen testing to detect current infections prompted the inclusion of probable case counts and the antigen test positivity rate in the data we post daily. The trends in this and other data shape our understanding of the course of the pandemic in Texas.”
After several months of posting three positivity rates for molecular tests, DSHS will retire the rates based on when lab results were reported to the state and the legacy rate which used the number of new confirmed COVID-19 cases over seven days divided by the number of new molecular test results over the same period, the DSHS announcement stated.